How Pareto Chart Analysis Can Improve Your Project
 The Pareto Principle
The Pareto Chart is a simple tool that can help you become a better project manager. It is a special type of histogram that helps to visualize a "rule" known as the Pareto Principle.
What is the Pareto Principle?
The Pareto Principle was discovered by a 19th century Italian economist and sociologist named Vilfredo Pareto (1848 - 1923). When he was researching the distribution of wealth in society, he found that 80% of the wealth was held by 20% of the population.
Even more interesting was that he was able to see similar distributions outside of economics. For example, in his own garden he found that 80% of his peas were produced by only 20% of the peapods he had planted.
Because of this particular distribution, this principle is also known as the 80/20 Rule and the Pareto Distribution. It can be generalized with the following statement.
"80% of the outputs result from 20% of the inputs."
- The Pareto Principle
But keep in mind, the specific ratio isn't that important. The main idea is that there are usually only a few inputs that generate most of the outputs. A Pareto Diagram can help you identify these "vital few" inputs
The Pareto Chart Makes it Clear
A Pareto Diagram has several key benefits...
- Helps the project team focus on the inputs that will have the greatest impact
- Displays in order of importance the inputs that matter in a simple, visual format
- Provides an easy way to compare before and after snapshots to verify that any process changes had the desired result
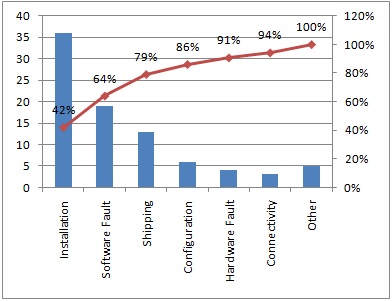
The chart lists the inputs along the horizontal axis in descending order of output frequency. The left vertical axis measures the number or frequency of the output for each input and is charted using a bar graph. The right vertical axis measures the cumulative percentage of the outputs and is charted using a line graph.
 Pareto Chart of Project Issues
In the sample Pareto diagram above, you can see that there are seven categories of Project Issues. It is evident that most of the issues, 42% to be exact, are related to "Installation." It is also very easy to see that three categories account for 79% of the issues: Installation, Software Faults, and Shipping.
Based on this Pareto analysis, if you focused your efforts on addressing just the Installation issues, you would have the potential to cut your total issues by more than 40%!
Using Pareto Analysis to Improve Your Project
As you can see, Pareto analysis is a great tool to identify the critical inputs to focus on that will give you the best results.
In addition to the basic Pareto diagram, there are other variations that you could use...
- Major Cause Breakdown: The "tallest bar" can be broken down into sub-causes using a second Pareto diagram
- Before and After: After a change has been made, create a second chart to show in a side-by-side comparison with the original chart
- Change the Data Source: Analyze the same problem from different perspectives. For example, from different departments, locations, equipment, and so on
- Change the Measurement Scale: Use the same inputs, but measure the outputs differently. For example, one chart can measure frequency and another chart can measure cost.
Using a Pareto chart to analyze problems in your project will allow you to focus your efforts on the ones that offer the greatest potential for improvement.
Related Articles About The Pareto Chart
Project quality management includes all the processes and activities needed to determine and achieve project quality. Learn 3 key quality management concepts that will help you deliver a high quality project.
What is Quality Assurance? Definition and Principles for Projects
What is quality assurance? Quality assurance principles and definition explained for project environments.
What is Quality Control? A Definition of Quality Control for Projects
What is quality control? A clear definition of quality control, the tools and techniques used to perform quality control, and how it differs from quality assurance.
Do You Want More Project Management Tips?

Subscribe to Project Success Tips, my FREE Project Management Newsletter where I share tips and techniques that you can use to get your Project Management Career off to a great start.
As a BONUS for signing up, you'll receive access to my Subscribers Only Download Page! This is where you can download my "Become A Project Manager Checklist" and other project management templates.
Don't wait...

New! Comments
Have your say about what you just read! Leave me a comment in the box below.